


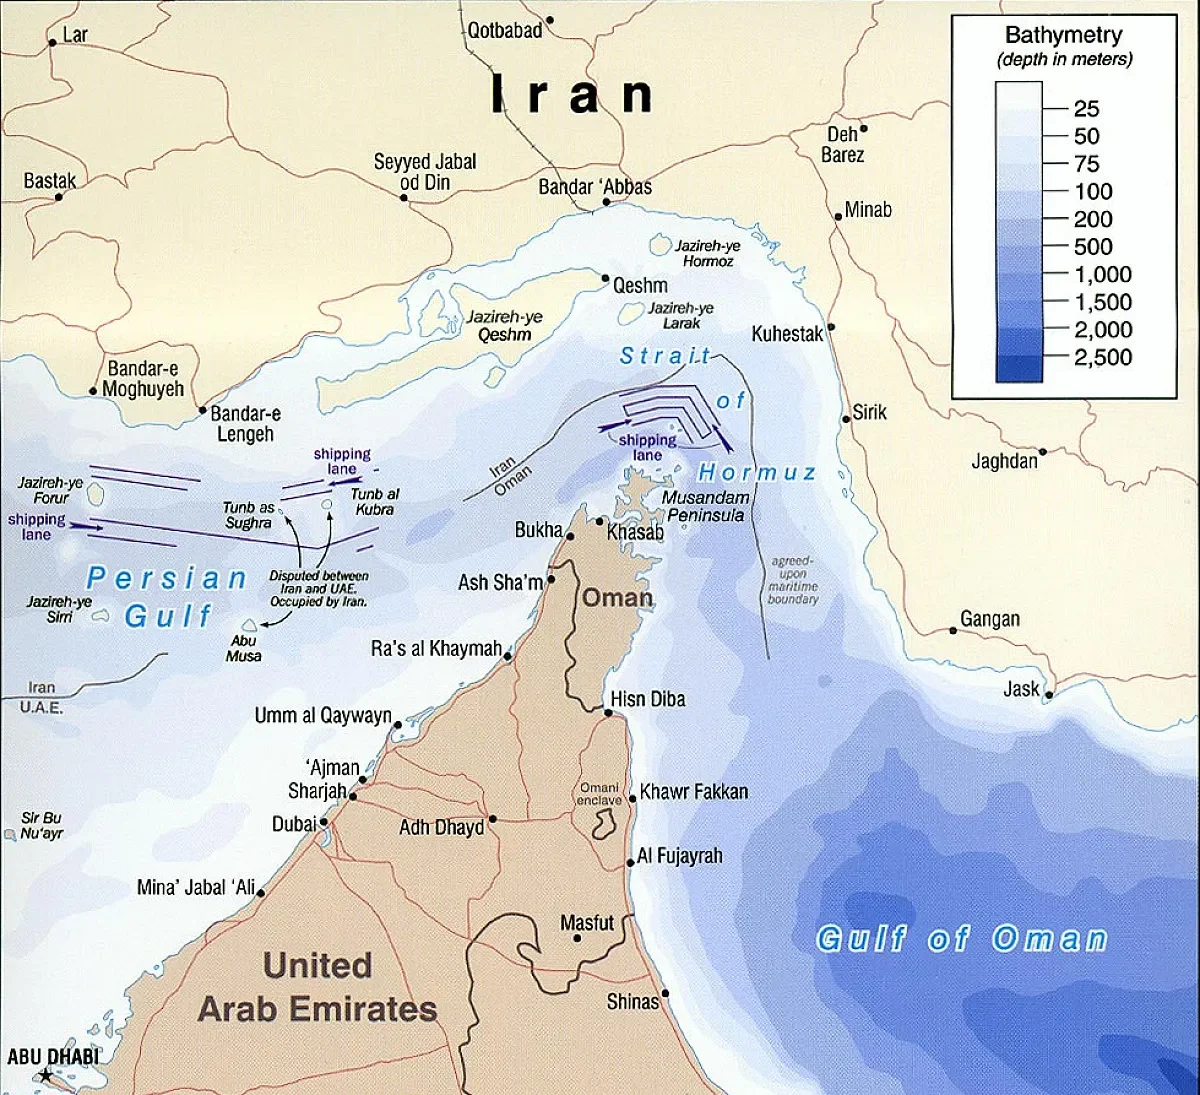
Commercial vessel traffic through the Strait of Hormuz fell 96 percent between September 1 and 27, 2026, compared to the same period in 2025, according to satellite tracking data from IMF PortWatch. The collapse marks the most severe disruption among the world’s five strategic maritime chokepoints, far outpacing declines at the Panama Canal, which recorded an 11 percent drop in daily transits over the same window.

Global Maritime Chokepoints: Daily Ship Transit Changes 2025 vs 2026
-
Global Maritime Chokepoints
-
Strait of Hormuz
- 84.6 ships/day (2025) → 3.7 (2026)
- Variation: -95.6%
-
Bab el-Mandeb
- 34.3 ships/day (2025) → 26.2 (2026)
- Variation: -23.6%
-
Strait of Malacca
- 244.1 ships/day (2025) → 219.4 (2026)
- Variation: -10.1%
-
Panama Canal
- 31.7 ships/day (2025) → 28.2 (2026)
- Variation: -11.1%
-
Suez Canal
- 42.2 ships/day (2025) → 40.7 (2026)
- Variation: -3.5%
-
Cape of Good Hope (alternate route)
- 94.1 ships/day (2025) → 86.6 (2026)
- Variation: -8.0%
-
Strait of Hormuz
Note: The Cape of Good Hope is the alternate route to Suez and Bab el-Mandeb, not a chokepoint itself.
Source: IMF PortWatch, portwatch.imf.org
The data reveals a global shipping network under simultaneous strain from geopolitical conflict, climate-driven water shortages, and shifting energy trade patterns. While Hormuz faces near-total paralysis, other chokepoints show varying degrees of contraction. Bab el-Mandeb lost 24 percent of daily vessel crossings, the Strait of Malacca declined 10 percent, and the Suez Canal dipped 4 percent. The Cape of Good Hope, an alternative route around Africa, also fell 8 percent.
Panama Canal’s Self-Imposed Limits Reshape Vessel Mix
Unlike Hormuz, where external conflict drives the collapse, Panama’s decline stems from operational restrictions imposed by the Panama Canal Authority (ACP). Low water levels in Lake Gatún forced the ACP to cut reservation slots from 34 to 32 per day on September 15, with a planned increase to 33 on October 15. Maximum draft at the neopanamax locks rose to 49 feet on September 28, still one foot below the normal 50-foot ceiling.
Panama Canal Transit Changes: Reservations, Draft, and Vessel Mix
Source: see article above
The restrictions have triggered a dramatic shift in the types of vessels using the waterway. From July 1 through September 27, tanker transits increased 4 percent compared to 2025, while bulk carrier crossings plummeted 31 percent. The surge in tanker traffic reflects rising U.S. energy exports to Asia, according to Filipe Gouveia, shipping analysis manager at BIMCO.
“Bulk carriers have faced more competition for transit slots from other sectors, especially tankers, as the United States has increased its energy exports to Asia,” Gouveia said in an analysis dated September 18, 2026. “The drop in bulk carrier transits through the Panama Canal has resulted in detours via the Cape of Good Hope or Cape Horn.” [Translated from Spanish]
The numbers tell a stark story. Tankers added just 0.54 vessels per day, while bulk carriers lost 1.99 daily transits. The net loss leaves the Canal operating well below its sustainable capacity of 36 to 38 vessels per day, according to ACP advisory A-34. In August, the Canal moved 33.19 ships daily, but the first full week with 32 reservation slots saw traffic fall 14 percent year-over-year.
Strait of Hormuz and the Global Energy Chokepoint Crisis
The near-total shutdown of the Strait of Hormuz carries outsized implications for global energy markets. The strait handles roughly one-quarter of the world’s seaborne crude oil and petroleum products, according to the U.S. Energy Information Administration. By comparison, the Panama Canal moves just 3 percent of global seaborne oil and derivatives, making it the smallest energy chokepoint among the five major passages.
Five Critical Oil Chokepoints: Flows, Status, and Alternate Routes
| Chokepoint | Oil crossing | Current status | Alternate route |
|---|---|---|---|
| Malacca | 23.2 M b/d · 29% | Open; 18% fewer tankers | Sunda or Lombok Straits, Indonesia |
| Hormuz | 20.9 M b/d · 26% | 4 ships per day, vs. 85 a year ago | No sea route; Saudi and UAE pipelines (4.7 M b/d capacity) |
| Suez and SUMED pipeline | 4.9 M b/d · 6% | Open; 4% fewer ships | Cape of Good Hope: about 15 extra days from Arabian Sea to Europe |
| Bab el-Mandeb | 4.2 M b/d · 5% | Houthi risk; 24% fewer ships | Cape of Good Hope, same route that avoids Suez |
| Panama Canal | 2.3 M b/d · 3% | 32 reservation slots (33 from Oct 15) and 49 ft draft | Strait of Magellan or Cape Horn: up to 8,000 extra miles |
Crude oil and refined products, in millions of barrels per day, and share of seaborne oil trade.
Source: EIA, eia.gov; IMF PortWatch, portwatch.imf.org; Panama Canal Authority (ACP)
Malacca, which carries 29 percent of seaborne crude and refined products, remains open but under pressure. Tanker traffic through the strait fell 18 percent during the September monitoring period. In 2023, nearly 60 percent of the crude oil transiting Malacca originated from Persian Gulf producers, highlighting the interconnected nature of these chokepoints. A disruption at Hormuz inevitably cascades into reduced volumes at Malacca weeks later.
Shipping Industry Adapts to a Fragmented Trade Map
The simultaneous pressures on multiple chokepoints are forcing shippers to rethink routing strategies. Bulk carriers abandoning the Panama Canal face longer voyages around Cape Horn or the Cape of Good Hope, adding weeks and fuel costs to each journey. BIMCO’s own data shows a 22 percent decline in bulk carrier transits through Panama since July, attributing the drop to both El Niño weather patterns and Canal restrictions.
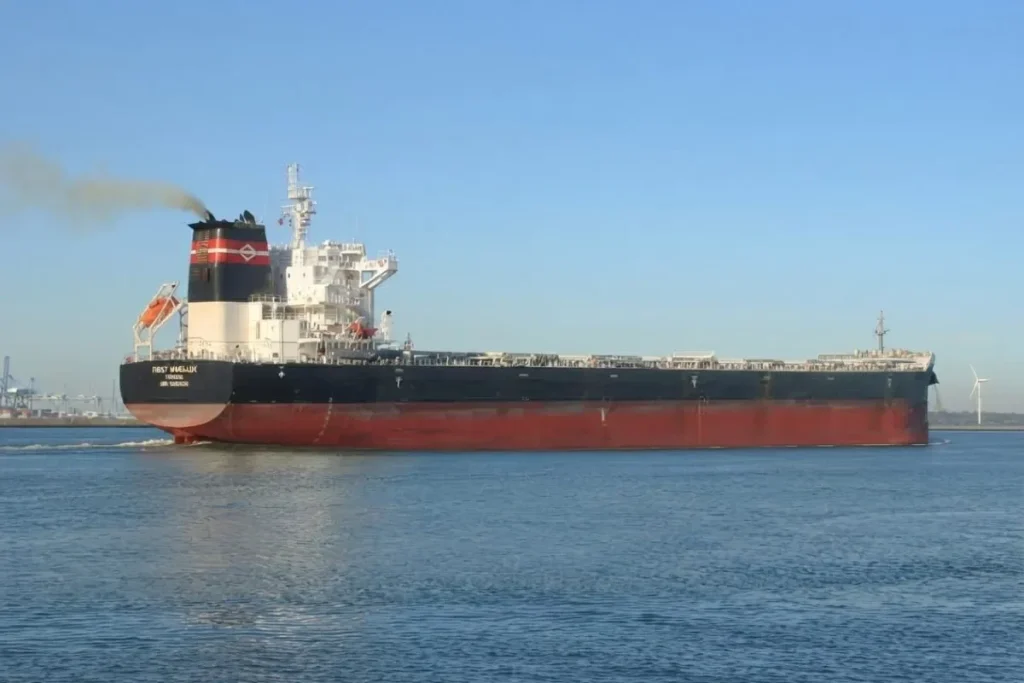
For importers and exporters relying on bulk commodities through Panama, the new reality demands earlier reservation planning or budgeting for extended routes. Investors in logistics infrastructure are watching the vessel mix shift closely. The tanker gains do not offset bulk carrier losses, leaving the Canal with reduced overall traffic and a changing customer base.
The IMF PortWatch data underscores a broader truth about maritime trade in late 2026. Chokepoints once assumed stable are now variables. Whether from conflict, climate, or commercial competition, the world’s shipping arteries are contracting simultaneously. The Strait of Hormuz may be the most dramatic case, but the pressures at Panama, Malacca, and Bab el-Mandeb suggest a shipping industry navigating a permanently altered map.